
To help answer this question, we looked at historical experience to see if there are any lessons to be learned from the impact of different yield curve shifts on portfolio returns. Going back 25 years, we used historical data for the 10-Year Treasury yield minus 2-Year Treasury yield to identify five periods of rapid yield curve steepening. These periods are indicated in Figure 1 below.
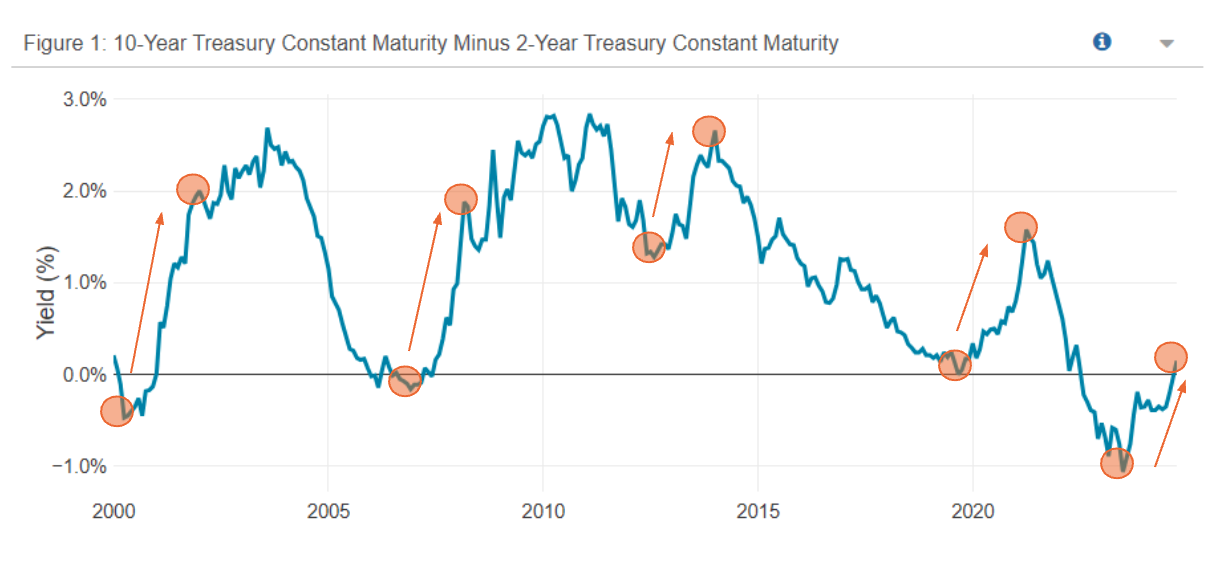
Source: Federal Reserve Bank of St. Louis, Jacobi.
We then looked at how broad-based portfolios of U.S. equities and fixed income assets, a 60-40 portfolio blend of the two, and cash performed during those periods. In our analysis, U.S. equity returns are represented by the total return of the SPDR® S&P 500 ETF, U.S. fixed income returns are represented by the total return of the Vanguard Total Bond Market Index Fund, and cash returns are represented by the total return of the Vanguard Treasury Money Market Fund. Past performance is not indicative of future returns.
Using Jacobi’s historical stress testing capabilities, we calculated the returns for the steepening periods as shown in Figure 2.
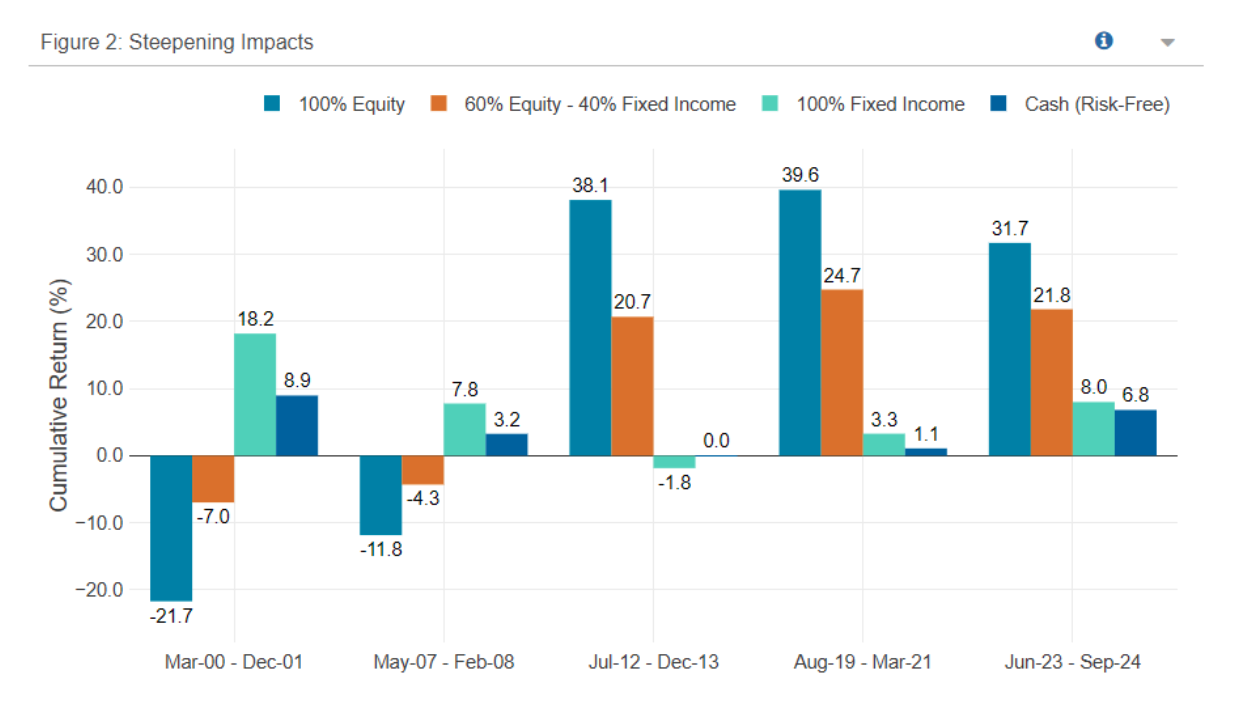
Source: Morningstar, Jacobi.
The returns in the steepening periods were mixed for equities, with two periods of negative returns and three periods of strong returns well in excess of cash. Fixed income returns were also mixed, with returns well in excess of the risk free rate in the first two periods, but below or close to the risk free rate in the latter three.
Of course, not all steepening periods are alike, so we drilled further into what drove change in the curve spread, to see if that shed any further light. Figure 3 plots the course of the 2-Year and the 10-Year yield over the period of analysis.

Source: Federal Reserve Bank of St. Louis, Jacobi.
Table 1 below shows the change in both the 2-Year and 10-Year yield over the periods of yield curve steepening.

Source: Federal Reserve Bank of St. Louis, Jacobi.
By separately looking at how the 2-Year and the 10-Year yields moved over the periods in question, certain trends can be identified. In the first two periods both the short and long end of the yield curve fell, which could be indicative of falling long-term growth expectations along with near-term pressures. These periods coincided with poor returns for equities, but strong excess returns for fixed income. By contrast, in the last three periods the long end of the curve was either flat or rose, coinciding with strong equity returns but weak or moderate fixed income returns.
What is evident is that simply identifying whether we are entering a period of rapid yield curve steepening is insufficient to predict how the major asset classes will perform. How investors see short and long-term growth prospects is important to discern whether a period of steepening will be characterized by buoyant risk asset returns (such as in the 2010s), or much weaker return like in the steepening periods of the 2000s.
Jacobi’s Scenario Analysis Capability
For this analysis we used Jacobi’s historical scenario analysis capabilities to identify periods of yield curve steepening and then calculate how particular assets or portfolios would have performed during those periods. Jacobi also enables scenario analysis based on risk factor shocks, which could also be used to complement this historical analysis. If you are interested to learn more about the scenario analysis and stress testing functionality available in Jacobi please don’t hesitate to contact us or learn more here.